
Evaluation of the Immigration National Security Screening Program: Program efficiency and GBA+
The evaluation examined the Program’s efficiency and conducted a GBA+ analysis of how the Program impacts different demographic groups. In terms of efficiency, the evaluation looked at the extent to which the INSS Program was efficient in using its resources to produce admissibility recommendationsFootnote 54. The GBA+ analysis responded to the Treasury Board Directive on Results requirement that evaluations take into account government-wide policy considerations such as gender-based analysis.
Efficiency of the security screening processes
Finding 18: NSSD doubled the number of recommendations issued per year between 2014 and 2019; at the same time, the number of recommendations issued per hour decreased.
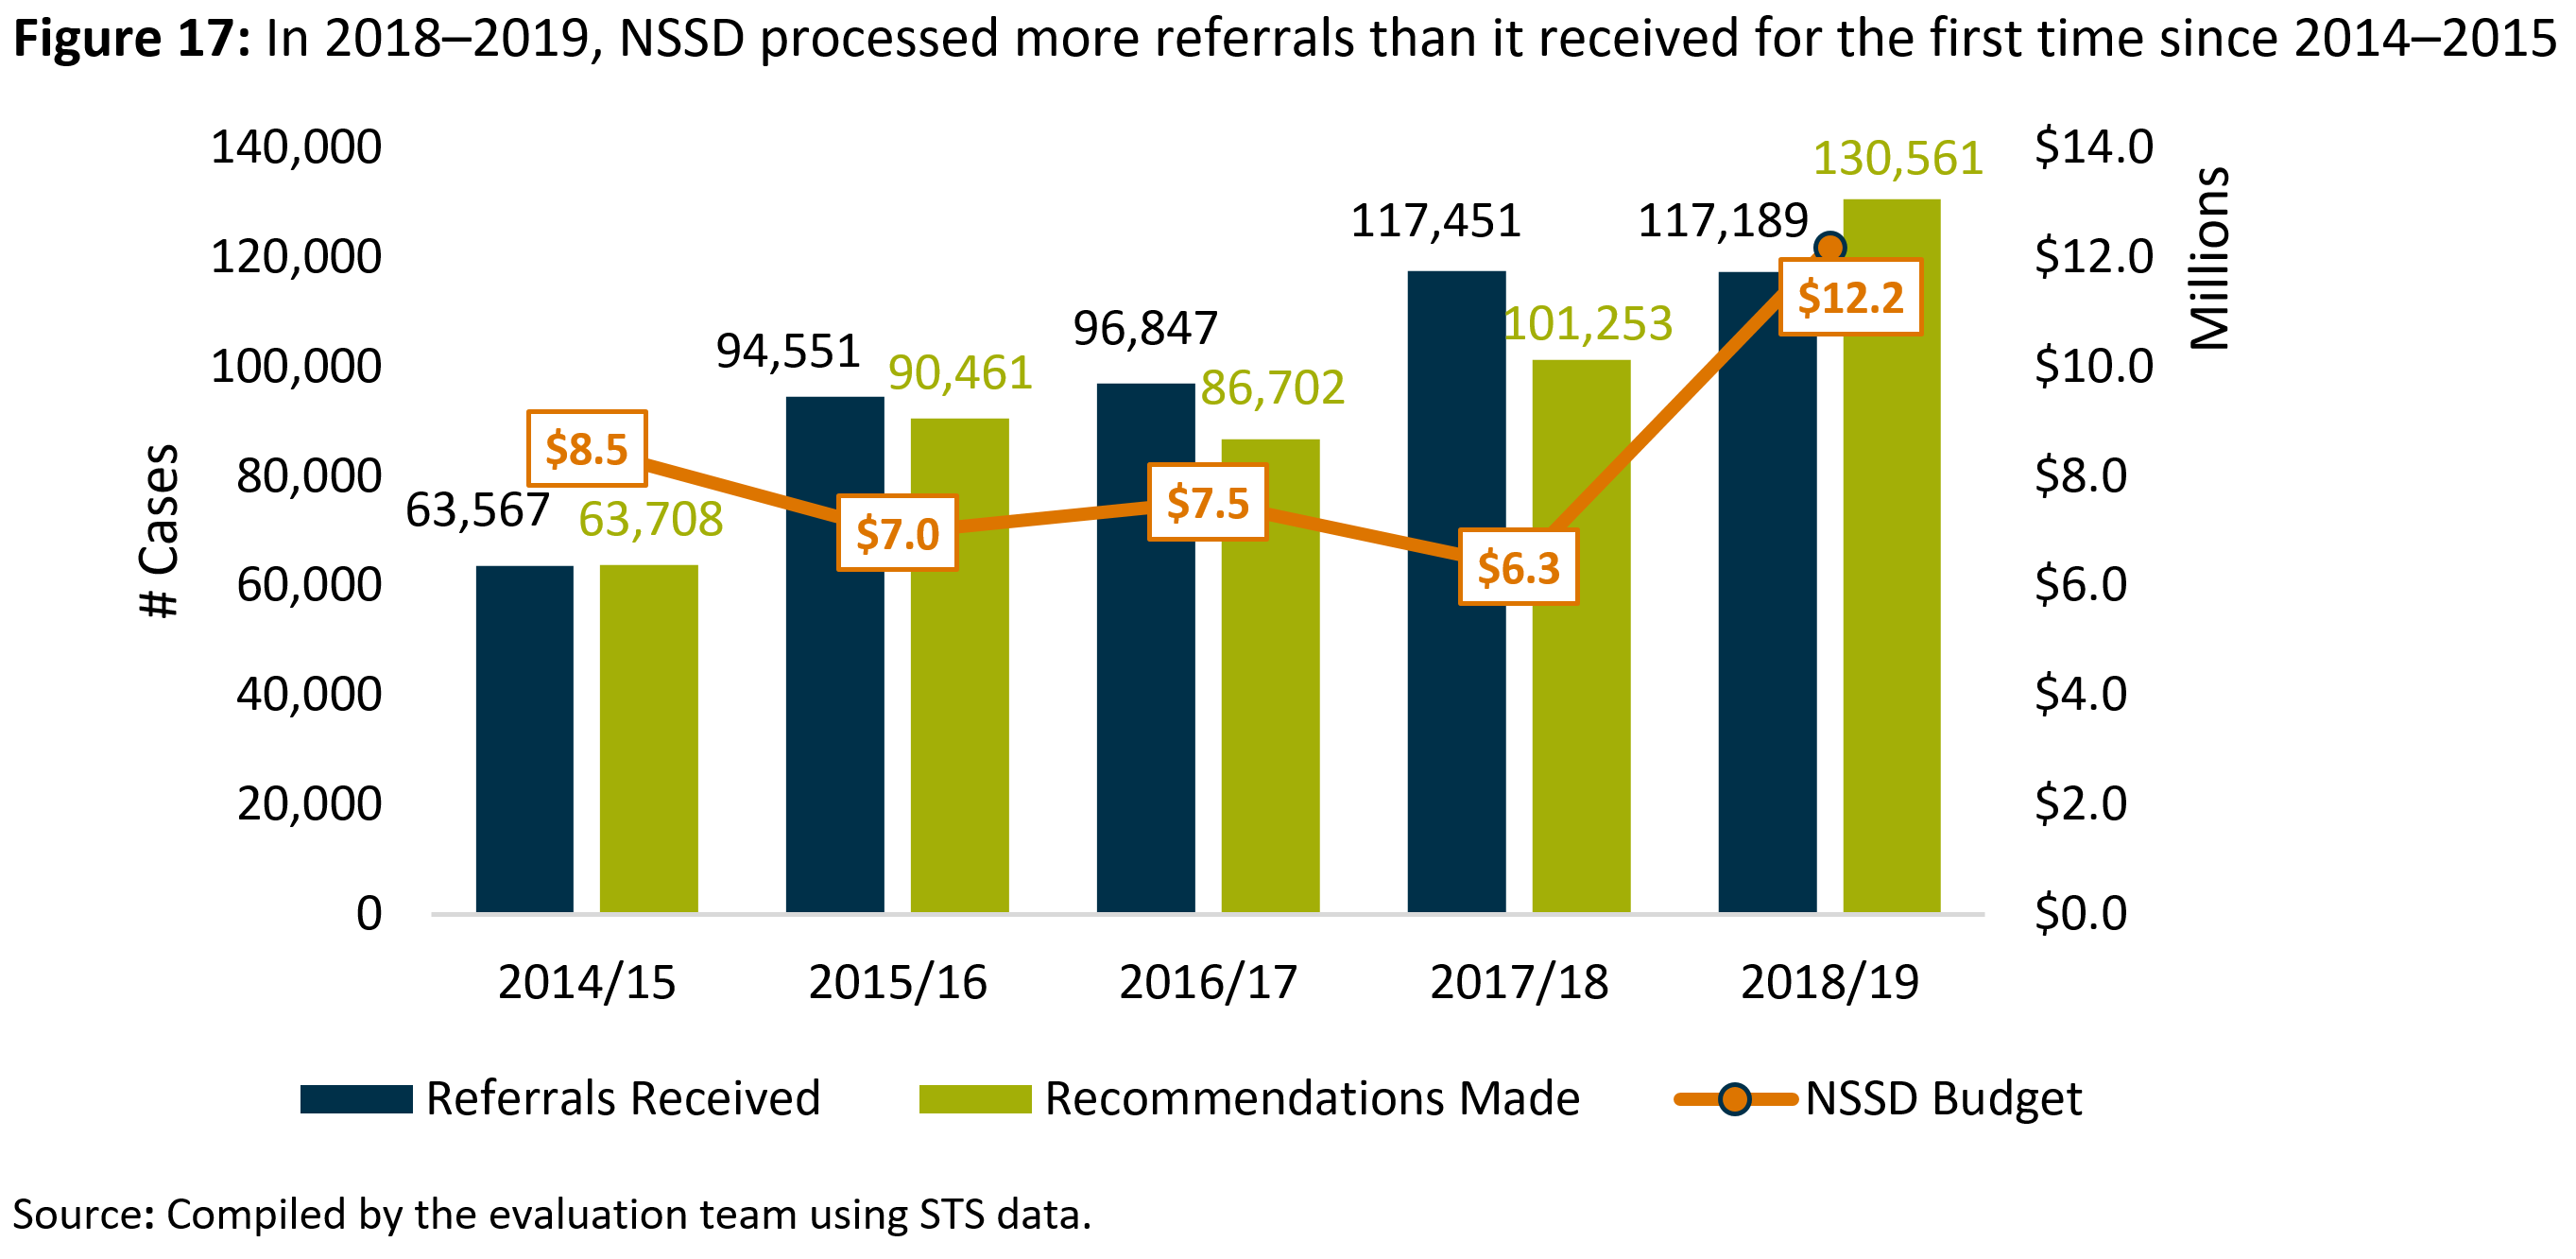
During the evaluation period, the NSSD was under pressure to be more efficient with its processes and resources. The number of recommendations issued by NSSD showed a steady upward trend over the evaluation period; in fact, twice as many were issued in 2018 to 2019 compared to 2014 to 2015. After enacting the BRTAP in 2018 to 2019, NSSD processed 11.4% more referrals than it received (see Figure 17). This was the first time recommendations had outpaced incoming referrals since 2014 to 2015, and an indication that NSSD was regaining control of its inventory and backlog.
Text version: Figure 17
Figure 17 shows that in 2018 to 2019, NSSD processed more referrals than it received for the first time since 2014 to 2015.
| Year | Number of referrals received | Number of recommendations made | NSSD budget (millions) |
|---|---|---|---|
| 2014 to 2015 | 63,567 | 63,708 | $8.5 |
| 2015 to 2016 | 94,551 | 90,461 | $7.0 |
| 2016 to 2017 | 96,847 | 86,702 | $7.5 |
| 2017 to 2018 | 117,451 | 101,253 | $6.3 |
| 2018 to 2019 | 117,189 | 130,561 | $12.2 |
Source: Compiled by the evaluation team using Secure Tracking System (STS) data.
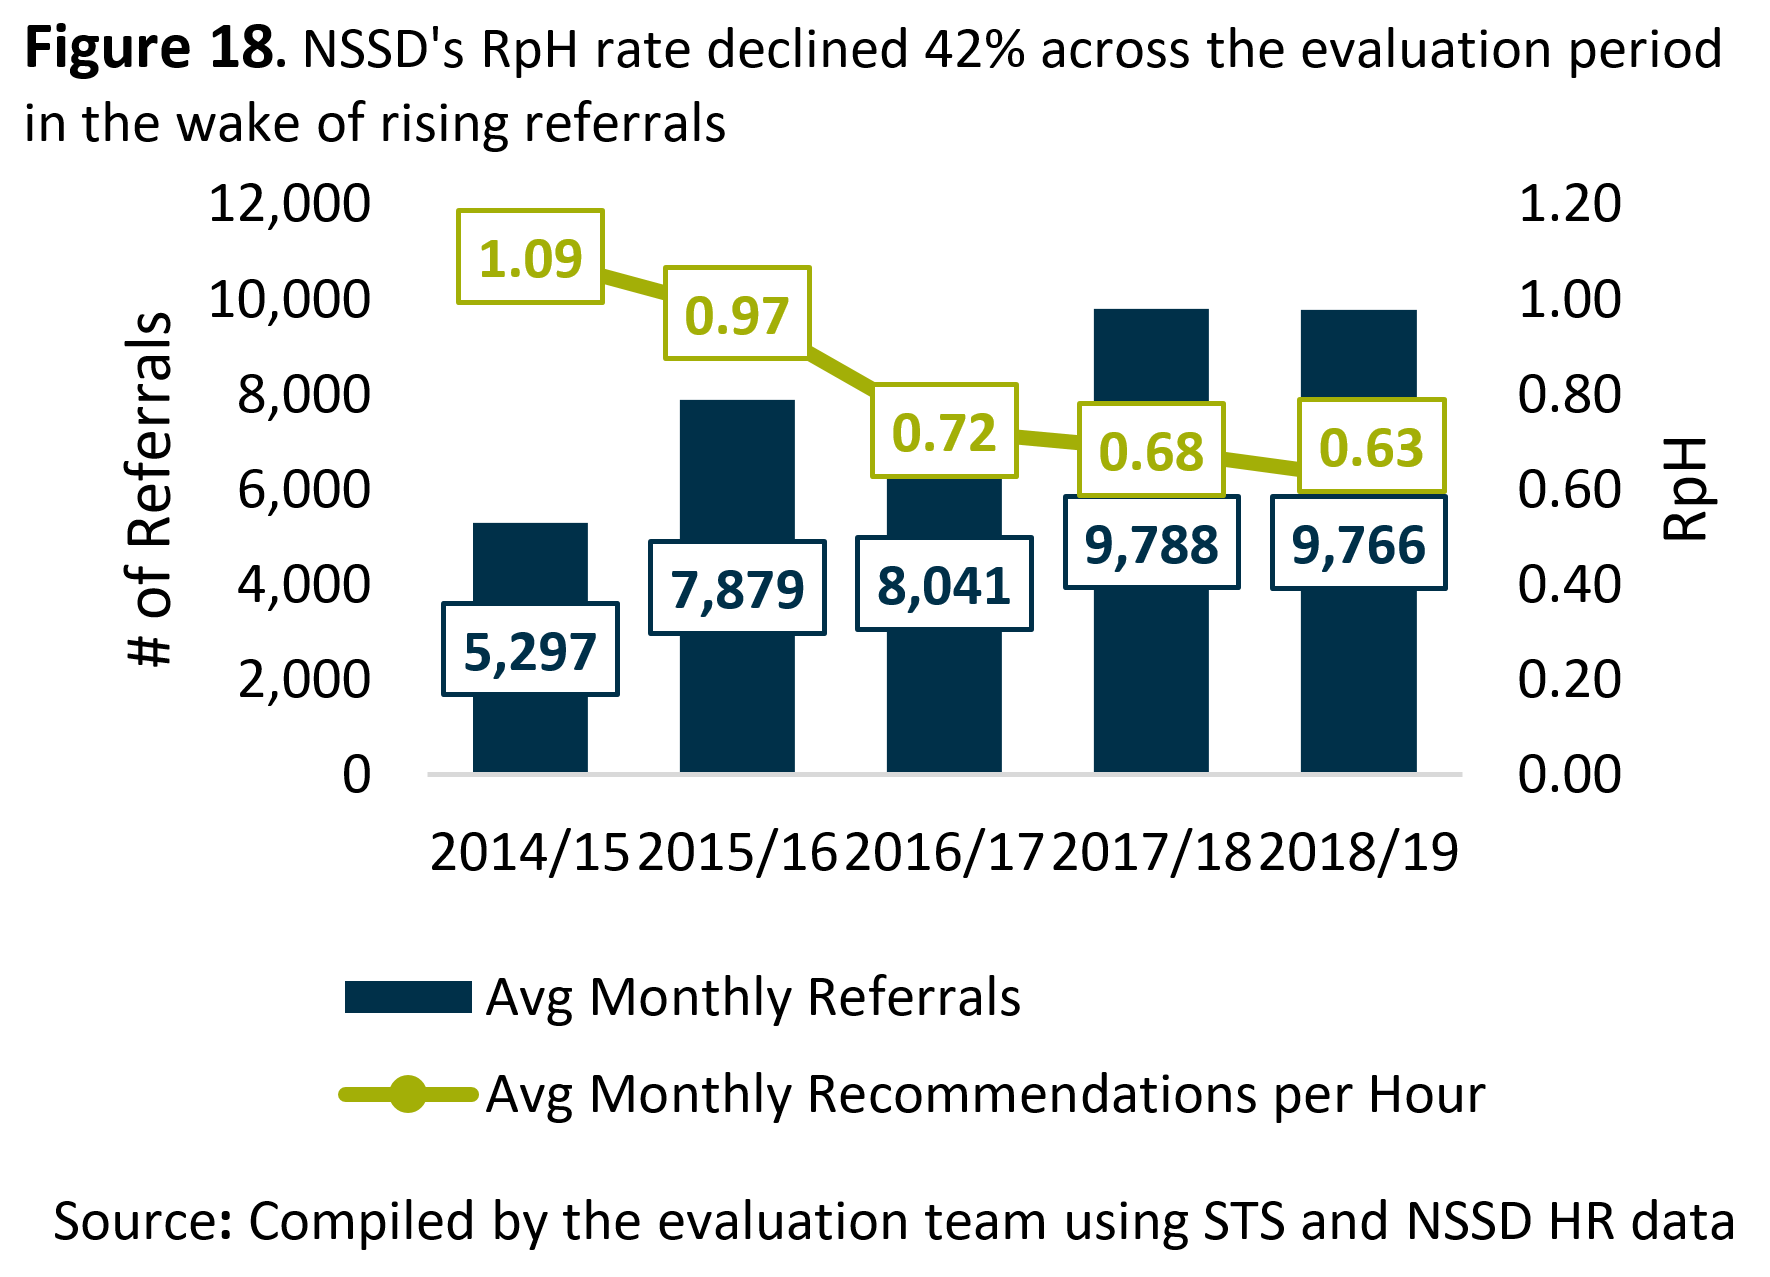
Despite the increase in the number of completed screenings, the average number of recommendations issued per hour of screening (RpH)Footnote 55 by each NSSD analyst decreased by 42% over the evaluation period (see Figure 18). In practice, this meant that NSSD produced fewer recommendations per every staff hour spent on screening activities. While this trend suggests decreasing efficiency, there are contextual factors to consider. NSSD maintains that higher quality and more robust recommendations have been issued in recent years, which have typically been more time consuming to research and document.
Text version: Figure 18
Figure 18 shows that NSSD's RpH rate declined 42% across the evaluation period in the wake of rising referrals
| Year | Number of average monthly referrals | Number of average monthly recommendations per hour (RpH) |
|---|---|---|
| 2014 to 2015 | 5,297 | 1.09 |
| 2015 to 2016 | 7,879 | 0.97 |
| 2016 to 2017 | 8,041 | 0.72 |
| 2017 to 2018 | 9,788 | 0.68 |
| 2018 to 2019 | 9,766 | 0.63 |
Source: Compiled by the evaluation team using STS and NSSD HR data
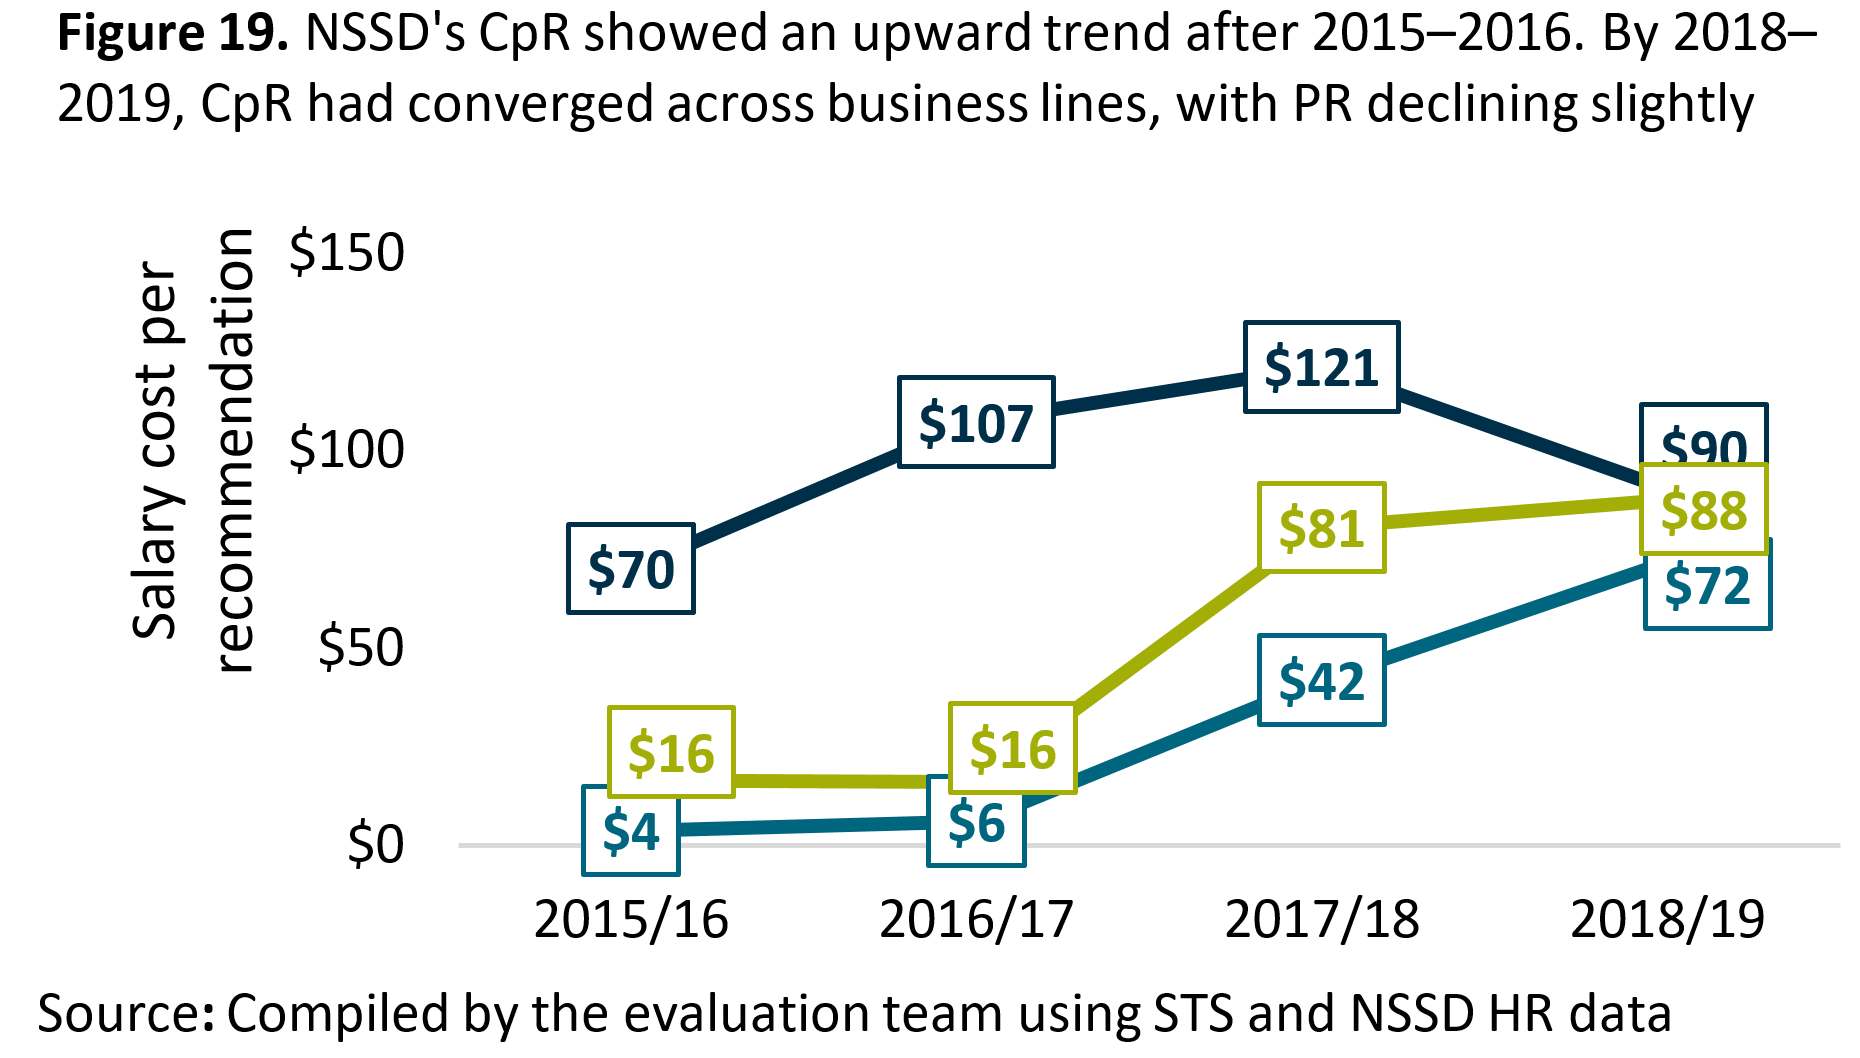
The average cost per recommendation (CpR) in terms of salary spent on screening activities allowed for a measure of how costly it was for NSSD to issue each recommendation. After 2015 to 2016Footnote 56, CpR generally increased, although the trend differed across business lines (see Figure 19). The increase in CpR is at least partly attributable to the increased use of overtime (OT) later in the evaluation period.
Text version: Figure 19
Figure 19 shows that NSSD's CpR showed an upward trend after 2015 to 2016. By 2018 to 2019, CpR had converged across business lines, with permanent residence (PR) declining slightly
| Year | Salary cost ($) per permanent resident recommendation | Salary cost ($) per temporary resident recommendation | Salary cost ($) per refugee claimant recommendation |
|---|---|---|---|
| 2015 to 2016 | 70 | 4 | 16 |
| 2016 to 2017 | 107 | 6 | 16 |
| 2017 to 2018 | 121 | 42 | 81 |
| 2018 to 2019 | 90 | 72 | 88 |
Source: Compiled by the evaluation team using STS and NSSD HR data
GBA+ analysis of referred applicants
A Gender-Based Analysis PlusFootnote 57 (GBA+) was conducted as part of the evaluation to assess how groups of women and men of diverse ages and nationalities may have been impacted by the INSS Program. The GBA+ analysis assesses whether certain groups are disproportionately over- or under-represented in programs and services. The security screening indicators applied to temporary residence (TR) and PR applicantsFootnote 58 (see Security screening indicators as a tool to manage referrals) focus on various individual characteristics, so there is the potential that certain GBA+ groups may be inadvertently or purposefully impacted more than others. These same characteristics could also result in a higher likelihood of an applicant being found inadmissible. As such, the referral rate of each concerned group and the type of recommendation each group is most likely to receive were considered.
Importantly, considering the nature of the security screening process and how areas of concerns are identified, the targeting of specific groups may be justified if these characteristics effectively point to higher applicant risk profiles. This is because individuals are not typically referred for screening solely on one factor. Instead, program guidanceFootnote 59 instructs that applicants’ characteristics are not to be considered in isolation, but as one of multiple characteristics that could indicate an inadmissibility concern. Therefore, the over or under representation by a specific group could be the result of a combination of factors at play.
GBA+ characteristics of applicants and their risk profile
Finding 19: Applicants who were most likely to be selected for security screening were also generally those who were found to pose security concerns.
Gender of applicants
Between 2014 to 2015 and 2018 to 2019, individuals that submitted a TR or PR application to Immigration, Refugees and Citizenship Canada were almost equally distributed between males (52%) and females (48%). [redacted]
![Figure 20. <strong>[figure is partially redacted]</strong>](images/fig20-eng.png)
Text version: Figure 20
Figure 20. [redacted]
Out of 15,967,784 applications submitted to IRCC:
- 48 % were submitted by females
- 52 % were submitted by males
Source: Compiled by the evaluation team based on the Canada Border Services Agency’s (CBSA) case management data (Secure Tracking System). Includes PR and TR referrals processed between April 2014 and March 2019.
Meanwhile, Table 2 displays the percentages of favourable, non-favourable, and inconclusive recommendations among applicants by gender. [redacted]
| Applicant’s gender | Favourable | Non-favourable | Inconclusive |
|---|---|---|---|
| Male | [redacted] | [redacted] | [redacted] |
| Female | [redacted] | [redacted] | [redacted] |
| Source: Compiled by the evaluation team based on CBSA case management data (Secure Tracking System). Includes PR and TR referrals processed between April 2014 and March 2019. | |||
Age of applicants
Overall, the age group distribution of individuals who applied for a PR or TR visa was similar to the age group distribution of those referred for security screening. Individuals aged [redacted] were both most likely to submit an application to Immigration, Refugees and Citizenship Canada (IRCC) ([redacted] % of all applicants) and to be referred for security screening ([redacted] %), followed by those aged [redacted]
However, [redacted] is aligned with the expectations and experience of the security screening partners. Applicants aged [redacted] are considered more likely to have been involved in activities of concern to Program partners, [redacted] applicants are more likely to have [redacted] that fall under section 35 of Immigration and Refugee Protection Act (IRPA). As well, there are often delays between the occurrence of an event of concern and the availability of sufficient information on the parties involved in the event and the specific role they played. These same factors may lead to [redacted] applicants among those who received inconclusive screening results, with the exception that in those cases, NSSD was [redacted]
Closer examination of the age distribution of applicants who received an inconclusive screening result indicated that the distribution was [redacted]. When these two groups were excluded from the calculations, the age distribution of applicants with inconclusive recommendations was similar to that of applicants who received favourable recommendations. This analysis highlights the importance of considering GBA+ factors in combination (e.g. gender, age and country of birth combined) as well as in a broader context of the Government of Canada’s priorities and how these impact the INSS program.
![Figure 21. Applicants who received Non-Favourable and Inconclusive recommendations <strong>[redacted]</strong> Favourable recommendations](images/fig21-eng.png)
Text version: Figure 21
Figure 21. Applicants who received Non-Favourable and Inconclusive recommendations [redacted] Favourable recommendations
Source: Compiled by the evaluation team based on STS case data. Includes PR and TR referrals processed between April 2014 and March 2019.
Country of birth of applicants
In terms of country of birth (COB), there was a notable difference between the general population of TR and PR applicants to IRCC and those referred for security screening, [redacted].Footnote 60 Applicants born in [redacted] were amongst those who most frequently received non-favourable recommendations (a combined total of [redacted] %), despite accounting for less than [redacted] % of all referrals to NSSD. On the other hand, while applicants born in [redacted] accounted for [redacted] % of all referrals, only [redacted] % of non-favourable recommendations were issued to [redacted] -born individuals. In terms of applicants who received inconclusive screening results, [redacted] % were born in [redacted], despite the fact that [redacted] -born applicants accounted for only [redacted] % of all referrals made to the NSSD (see Figure 22).
![Figure 22. Aside from <strong>[redacted]</strong>, applicants referred for screening were typically born in countries different than the <strong>[redacted]</strong> <abbr>COB</abbr> for submitted applications](images/fig22-eng.png)
Text version: Figure 22
Figure 22. Aside from [redacted], applicants referred for screening were typically born in countries different than the [redacted] COB for submitted applications
Source: Compiled by the evaluation team based on IRCC and STS case data. Includes PR and TR referrals processed between April 2014 and March 2019.
The percentages of different recommendation types for applicants born in the countries that generated the most applications (redacted) and/or referrals (redacted) are shown in Table 3.
| Applicant’s CoB | Favourable | Non-favourable | Inconclusive |
|---|---|---|---|
| [redacted] | 90% | 3% | 7% |
| [redacted] | 98% | 0% | 1% |
| [redacted] | 35% | 5% | 59% |
| Source: Compiled by the evaluation team based on CBSA case management data (Secure Tracking System). Includes PR and TR referrals processed (e.g. with a recommendation issued) between April 2014 and March 2019. | |||
The large proportion of referred [redacted]-born applicants who were mostly screened as favourable may be explained by a very broad security screening indicator that mandated all [redacted] applicants of [redacted] born in [redacted] be referred. Program stakeholders acknowledged that the indicator generated a large number of unnecessary referrals, and was eliminated in May 2018. In turn, the large representation of applicants born in [redacted] among those receiving inconclusive screening results can be attributed to a bilateral agreement between Canada and [redacted] for NSSD to obtain the information needed to make conclusive inadmissibility decisions.
In summary, it is clear that the INSS Program impacts different GBA+ groups of applicants [redacted]. From the analysis, [redacted] to be referred for screening [redacted], which was aligned with their risk profile. For COB, the GBA+ analysis showed potential for program effectiveness improvement. Overall, it was recognized that risk assessment is based on multiple factors and certain groups of people may be more negatively impacted as a result of the combination of factors, rather than a single factor (such as age or COB alone). The Program would benefit from a thorough analysis of the alignment (or lack thereof) between applicants’ GBA+ characteristics and their actual risk profiles, including the combination of different characteristics (e.g. [redacted]). Such analysis could assist in further refining the security screening indicators, which, in turn, could result in greater Program effectiveness ([redacted]).
- Date modified: